Sputtering Uniformity
The AJA ATC 2200 is equipped with 6 DC magnetron sputtering guns and a rotating chuck. A set of experiment was performed to assess the uniformity of the sputtering system.
The process parameters for the experiment is as follows. The gun angles are set at approximately 5.5 [mm] or ~30.5°. The 3″ Magnetic holder chuck is used for this experiment. The chuck position is set at 70 mm, which is equivalent to setting a 3″ wafer holder chuck at 60 mm. The chuck is rotated using 100 [%] of the motor’s power, producing a rotation rate of approximately 17 [rpm]. After the system has reached base pressure, the process gas was turned on, flowing Argon into the chamber at a rate of 35 [sccm]. Once the chamber pressure stabilized at 20 [mTorr], power is applied to a single gun. After 5 minutes of pre-sputtering to clean to target, the chamber pressure is reduced to 2.5 [mTorr]. Then the gun shutter is open to begin deposition. After 10 minutes of deposition, the equipment is returned to idle and the wafer is retrieved. This is performed 4 more times to test the uniformity of the remaining 4 guns.
In order to measure the thickness of the film, the wafer was specially prepared before deposition. A 3″ <100> Silicon wafer with 500 nm of thermal oxide was marked with a fine tip Sharpie marker. Four solid straight lines were marked from from edge to edge, sectioning the wafer into 8 equal slices. After material has been deposited on the wafer, it was submerged in acetone to dissolve the marked lines. Ultrasonication is often used to quickly dissolve the marked lines. This method effectively removes any material above the marked lines, effectively producing a sharp transition between the deposited material and the wafer surface.
The step height is measured using an atomic force microscope. Seven points are measured along a single line. Starting from the center, the measurement points are spaced approximately 1 mm apart. This set of measurement is sufficient to assess the uniformity of the entire wafer since the chuck was rotating during deposition. Figure 1 is shows the deposition profile of each gun, labeled by the material of the target. It is evident that each gun produces the same deposition profile on the wafer and that the uniformity is approximately ±4 [%].
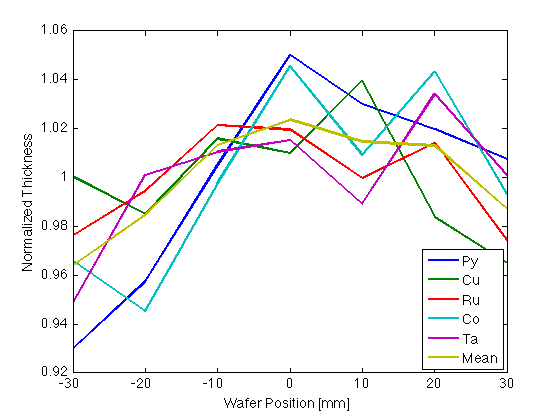
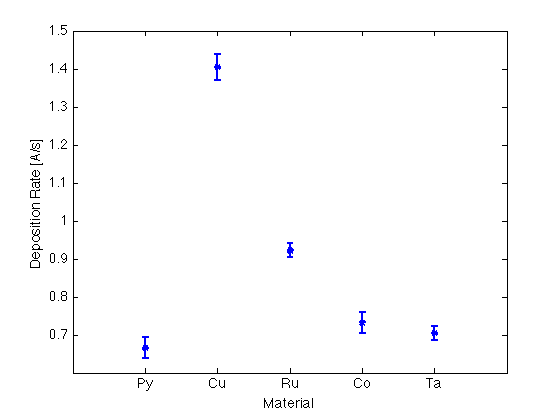
Figure 2 is a graph comparing the deposition rate of each film. The rates are measured from the center of the wafer. Each point was measured 5 times. The error in the measurement is approximately ±2 [%].