Base Pressure
The base pressure in a sputtering system can be an important process parameter because it influences the contamination rate of trace gases. Table 1 shows an estimate of the amount of trace gases striking a surface for varying degree of vacuum. To put this in perspective, a typical sputtering rate is approximately 1 angstrom per second. So at a base pressure of 1×10⁻⁶, the amount of trace gases striking the surface of a substrate outnumbers the sputtered material by a factor of 3. These trace gases may affect the film property by reacting with the film or simply gets included in the film as impurities.
| Degree of Vacuum | Pressure [Torr] | Gas Density [molecules per m3] | Mean Free Path [m] | Time per Monolayer [s] |
|---|---|---|---|---|
| Atmospheric | 760 | 2x1025 | 7x10⁻⁸ | 10-9 |
| Low | 1 | 3x10²² | 5x10⁻⁵ | 10-6 |
| Medium | 10-3 | 3x10¹⁹ | 5x10⁻² | 10-3 |
| High | 10-6 | 3x10¹⁶ | 5x101 | 1 |
| Ultra-high | 10-10 | 3x10¹² | 5x10⁵ | 104 |
Trace Gas Composition
The composition of trace gas varies with the degree of vacuum. Table 2 shows the major gas loads at various degrees of vacuum. Water vapor is the most difficult gas to pump out from a system. When any surface is exposed to atmosphere, a thin film of water adsorbs onto the chamber walls. At 10-4 [Torr], water amounts to 99% of the gas load. Water vapor is a relatively sticky gas compared to other constituents of air. Other gases bounces right off of surfaces, but water vapor sticks and unsticks from surfaces.
| Degree of Vacuum | Pressure [Torr] | Major Gas Load |
|---|---|---|
| Atmospheric | 760 | Wet Air |
| Rough | 10-3 | Water Vapor |
| Medium | 10-6 | H2O, CO |
| High | 10-9 | H2O, CO, N2, H2 |
| Ultra-high | 10-10 | CO, H2 |
| Ultra-higher | 10-11 | H2 |
Residual Gas Analyzer
A residual gas analyzer (RGA) is a useful tool to diagnose vacuum. An RGA is based off of mass spectrometry and can have sensitivities of 10-10 [Torr]. Table 3 shows some common gases and their atomic mass units. Nitrogen and carbon monoxide shares the same atomic mass units, so it is difficult to distinguish between the two without look for signatures of the gas. For example, carbon monoxide has 3 signatures: CO at 28 amu, O at 16 amu and C at 12 amu. When monitoring the gas load with time, we track the gases listed in the table since the amu of these gases are unique enough from what is commonly found in a vacuum chamber.
| Gas | amu |
|---|---|
| Hydrogen | 2 |
| Water | 18 |
| Nitrogen | 28 |
| Carbon Monoxide | 28 |
| Oxygen | 32 |
| Argon | 40 |
Pumping Water
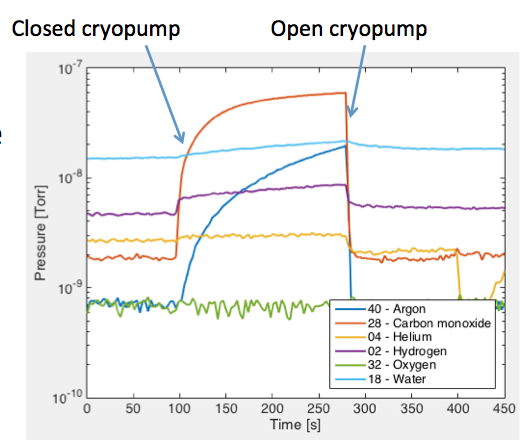
Figure 1 shows the pressure of various gases in the vacuum chamber as a function of time. The RGA is set to detect only the gases described previously. The system has been pumped for approximately 5 days, but it was used probably up to 10 times during this period. The system was not disturbed for at least 14 hours. The chamber’s pressure as measured by the ion gauge is 2×10⁻⁸ [Torr]. The first 100 [seconds] from figure 1 shows the pressure of the residual gases monitored in the chamber. When the cryopump valve is shut off at 100 [seconds], the partial pressures increases due to internal leaks. The partial pressure of Oxygen remains unchanged after closing the cryopump valve, indicating that there is no external leak. The increase in Argon pressure may be caused by a leaky mass flow controller or trapped argon in a low conductance line.
When the cryopump valve is opened at approximately 300 [seconds], all gases are evacuated immediately to their base pressure. Water, on the other hand, is pumped at a very slow rate due to the slow desorption rate of water. In order to improve the evacuation rate of water, the chamber must be heated to increase the desorption rate. Unfortunately, no matter how low the base pressure of our sputtering chamber may be, it is exposed to sufficient amount of water vapor during sample exchange that it is not practical to run processes at ultra-high vacuum levels.
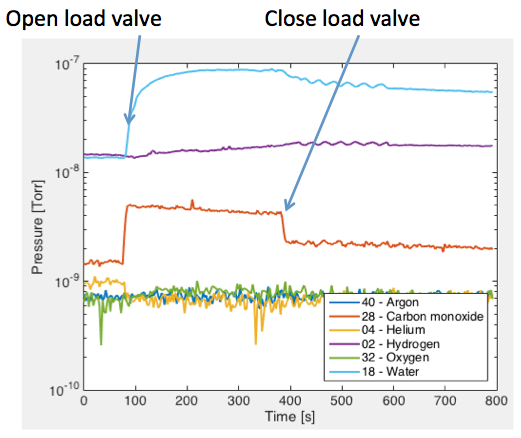
In figure 2, we monitor the RGA as a sample is loaded into the process chamber. The load lock exposed to atmosphere for approximately 1 minute before it was pumped to a pressure of 1.4×10⁻⁶ [Torr]. When the loadlock isolation valve is opened at approximately 100 [seconds], the pressure of water vapor and nitrogen and/or carbon monoxide to rise. When the loadlock isolation valve is closed at approximately 400 [seconds], the pressure of water vapor drops slowly. At 5 minutes after the loadlock isolation valve is closed, the pressure of water vapor is still 400% higher than the base level. It will take approximately 30 more minutes to recover to the base level. The huge influx of water vapor is being emitted by the sample and the sample chuck, and to a smaller degree the loadlock.