An electron beam lithography system uses a series of lenses to force a beam of electrons to land accurately and precisely on the sample. Accuracy refers to the likelihood an electron lands at the target and is defined by the terms beam drift, deflection error and field distortion. Higher accuracy is achieved by providing a stable operating environment and more frequent calibration.
Beam Drift
The position of the electron beam is driven by a scanner called the primary deflector. When the electron beam is moved by any other mechanism, it results in errors in the replication of the desired pattern. The unwanted motion of the electron beam is called Beam Drift.
The primary cause of beam drift is temperature variation. When the components in an electron beam system heats up or cool down, their mechanical and electrical properties changes slightly. One component may become larger, another component may shift a little to the left, the resistance of another component may increase, and so on. The accumulated effect of all these changes will affect the position of the beam. When an electron beam writer is installed in a controlled environment and given time to stabilize, beam drift can be reduced below 50 [nm/hr].
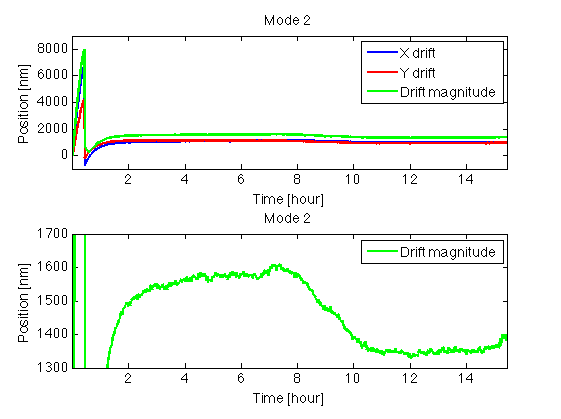
The system custodian can characterize beam drift, by measuring the beam position at specific time intervals. To capture a beam drift profile, the JBX-5500FS electron beam writer was stabilized for at least 24 hours in Mode 4 (the high resolution lens); then the system is switched to Mode 2 (the general purpose lens). Figure 1 shows a record of the beam position measured every minute over a 15 hour period. Within the first 30 minutes, the beam drifted beyond the range of the measurement window. At this point, the drift experiment was interrupted to center the beam before resuming the measurements. Nonetheless, the beam drift is significant when a lens is changed and it takes a couple of hours to stabilize. The bottom graph in Figure 1 highlights the stability of the beam position, revealing that after 2 hours, the drift rate never exceeds 100 [nm/hr].
Figure 1: The position of the beam drifts significantly right after energizing the lens (top), but it can be very stable once the lens has warmed up (bottom).
Figure 2 shows a record of the beam position measured every minute when the lens for Mode 4 is energized after the system has stabilized in Mode 2 for at least 24 hours. The drift rate in Mode 4 is approximately 10 times slower than Mode 2 since it has a 10 times smaller scan field. After a couple hours, the drift rate does not exceed 60 [nm/hr]. The bottom graph in Figure 2 highlights a very stable length of time where the drift rate does not exceed 20 [nm/hr].
Figure 2: The position of the beam drifts significantly right after energizing the lens (top), but it can be very stable once the lens has warmed up (bottom).
Whether or not beam drift is a problem depends on the amount of time needed to complete an exposure and the tolerances of the layout. Below is a table that lists the drift rate each hour after the mode is changed. These values are extracted from a single set of measurements, so they should only be used as crude approximations. In general, the JBX5500FS electron beam writer is sufficiently stable after a couple of hours of switching modes.
Hour
Mode 2
[nm/hr]
Mode 4
[nm/hr]
0 to 1
10800
1350
1 to 2
640
100
2 to ...
75
60
Deflection Correction
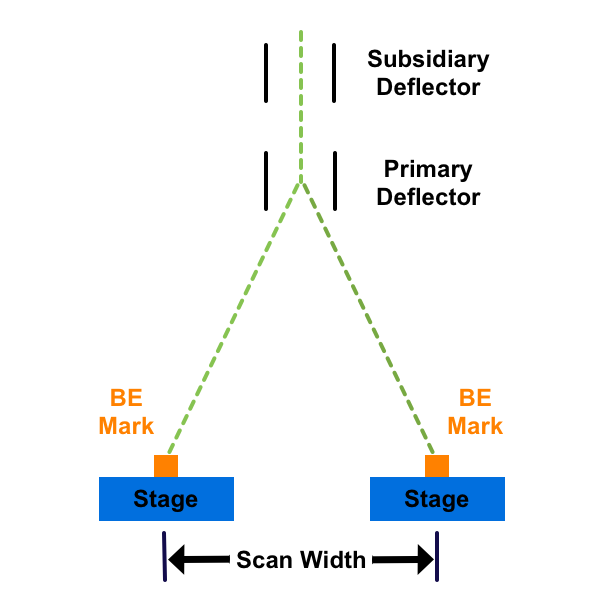
Deflection correction uses the BE mark, the stage and the laser interferometer to calibrate the positioning deflector and the scanning deflector. The position deflector is called the Primary Deflector or PDEF. The scanning deflector is called the subsidiary deflector or SUBDEF. The table below specifies the scan widths for each deflector depending on the mode.
Deflector
Mode 2
[μm]
Mode 4
[μm]
Primary Deflector (PDEF)
1000
100
Subsidiary Deflector (SUBDEF)
10
1
Deflection correction automatically corrects the deflection gain and corrects the rotation for the position and scanning deflectors. To correct the beam deflection width, the position of the BE mark is measured when the stage is moved. The deflection gain and rotation parameters are adjusted such that the position of the BE mark measured by the deflection converges to the position of the BE mark measured by the stage displacement. The stage displacement is measured using a laser interferometer which has a resolution of 0.6 nm. Figure 3 depicts the principle behind deflection correction.
Figure 3: The deflection system deflects the beam to sweep it across the surface.
The deflection correction program has a few parameters that a custodian may configure.
Measurement field size [μm]
The width of the scan field to be used for calibration
Allowable gain convergence value [μm]
The maximum allowable deflection error
Allowable rotation convergence value [μm]
The maximum allowable rotation error
Distortion Correction
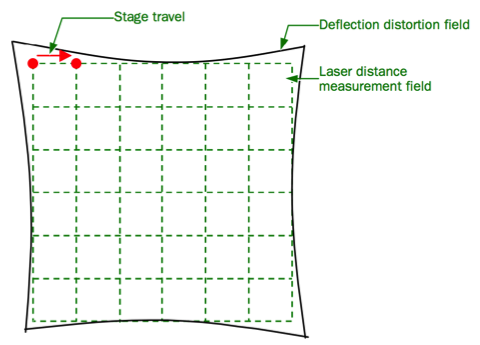
Distortion correction is used to measure the distortion in the scan field and generate a correction table. Deflection distortion is measured by detecting the BE mark position while moving the stage to specific points on a grid. Figure 4 shows a 7 x 7 grid representing the stage position and a set of points representing the position of the scanner. The correction table is used to correct the position of the beam in order to achieve a grid like scan.
Figure 4: The shape of an actual scan is distorted compared to a grid.
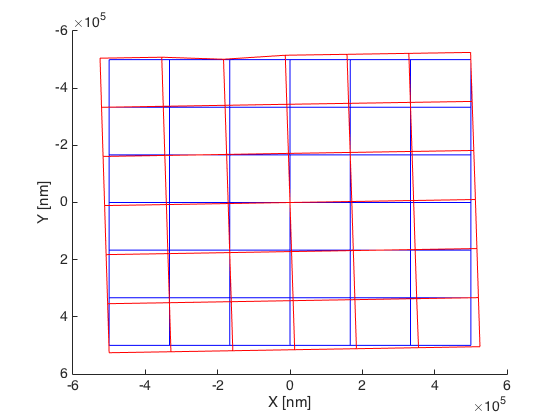
Figure 5 shows the distorted scan field of Mode 2 that is measured by running the distortion correction program with a 7×7 grid. The maximum distortion along the x and y axis is 2526 nm and 2561 nm, respectively. Since the field size for mode 2 is 1 mm x 1 mm, the maximum positioning error with no distortion correction is approximately 0.25%. Upon closer inspection of figure 5, the field appears to be rotated counterclockwise by approximately 0.1 degrees. This rotation may be caused by performing the distortion correction when the beam is not focused on the BE mark.
Figure 5: The deflection distortion (red) is overlaid on a perfect grid (blue). The deflection error is amplified by 10X to make it easier to see.
Figure 6 shows the distorted scan field of Mode 4 that is measured by running the distortion correction program with a 7×7 grid. The maximum distortion along the x and y axis is 160 nm and 415 nm, respectively. Since the field size for mode 4 is 100 μm x 1 μ, the maximum positioning error with no distortion correction is approximately 0.8%.
Figure 6: The deflection distortion (red) is overlaid on a perfect grid (blue). The deflection error is amplified by 10X to make it easier to see.
The distortion correction program has a few parameters that a custodian may configure.
Execute Distortion Correction
Enables distortion correction
Measurement Points
Select the number of points for the correction table: 3x3, 5x5 or 7x7
Distortion Convergence Allowance [um]
The maximum allowable deviation from the expected position