An electron beam lithography system uses a series of lenses to force a beam of electrons to land accurately and precisely on the sample. Precision refers to how tightly each electron clusters at the target and is defined by the terms beam size and beam shape. Conventionally, the beam is considered to have a Gaussian shape and the beam size is specified as the full-width half maximum (FWHM) of the Gaussian distribution. The beam shape is actually elliptical instead of circular, so it is defined more completely as the FWHM of a Gaussian distribution along the X and Y axis. In general practice, the beam size and beam shape is optimized either by focusing to produce a sharp image of a resolution target or executing a focusing routine.
Gold (AU) Mark
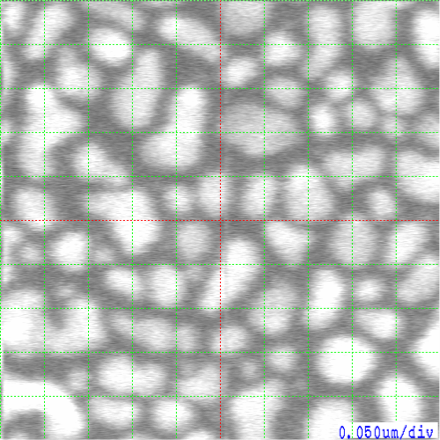
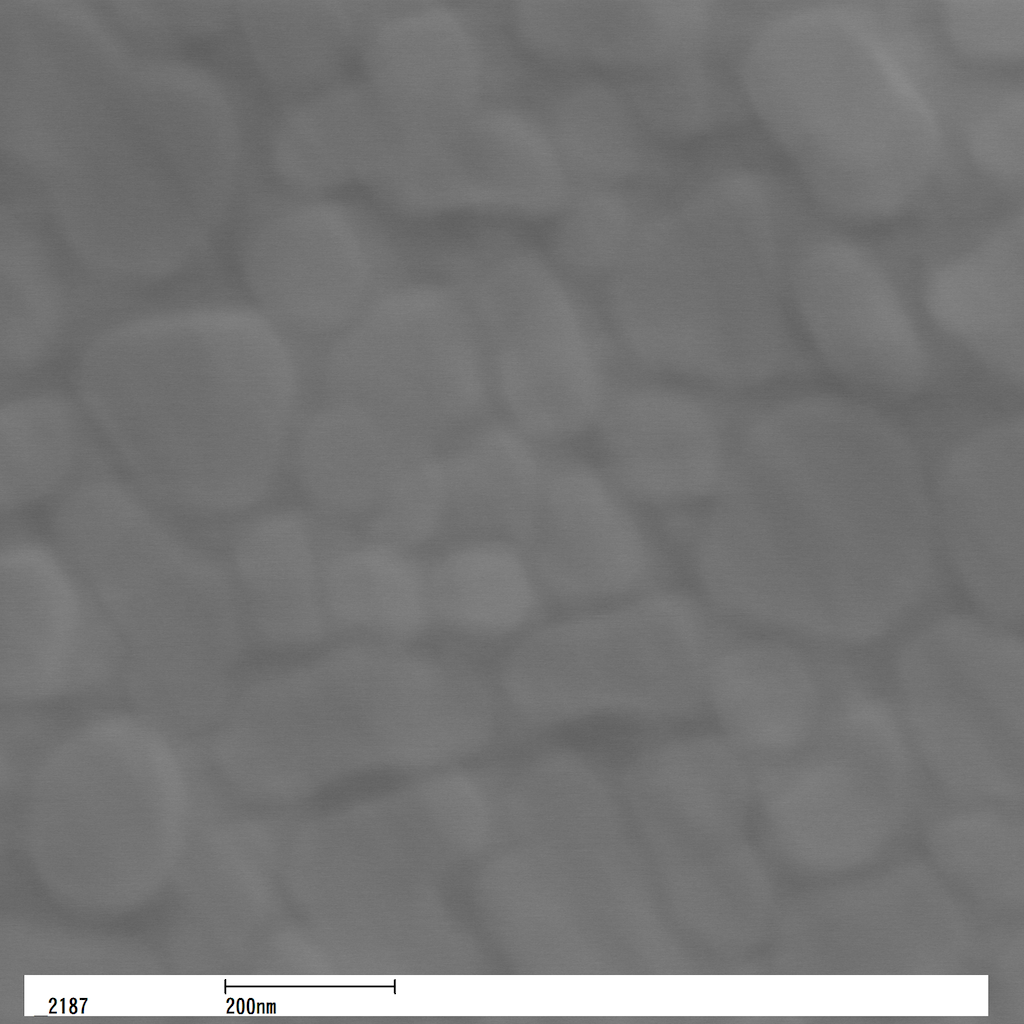
The gold (AU) mark is used to manually optimize the beam size and shape. The gold mark used in a Jeol JBX-5500FS electron beam writer is shown in Figure 1. The gold mark contains gold nanoparticles scattered on a membrane. A sharp image of the gold nanoparticles can be obtained when the focus and astigmatism are optimized. The achievable sharpness of the image depends on the objective lens (standard vs high resolution lens) and the beam current. The smallest nanoparticles visible is a qualitative indicator of the beam size. If a 20nm nanoparticle is sharply visible, the beam size must be smaller than 20nm!
Figure 1: The gold mark contains gold nanoparticles scattered on a membrane.
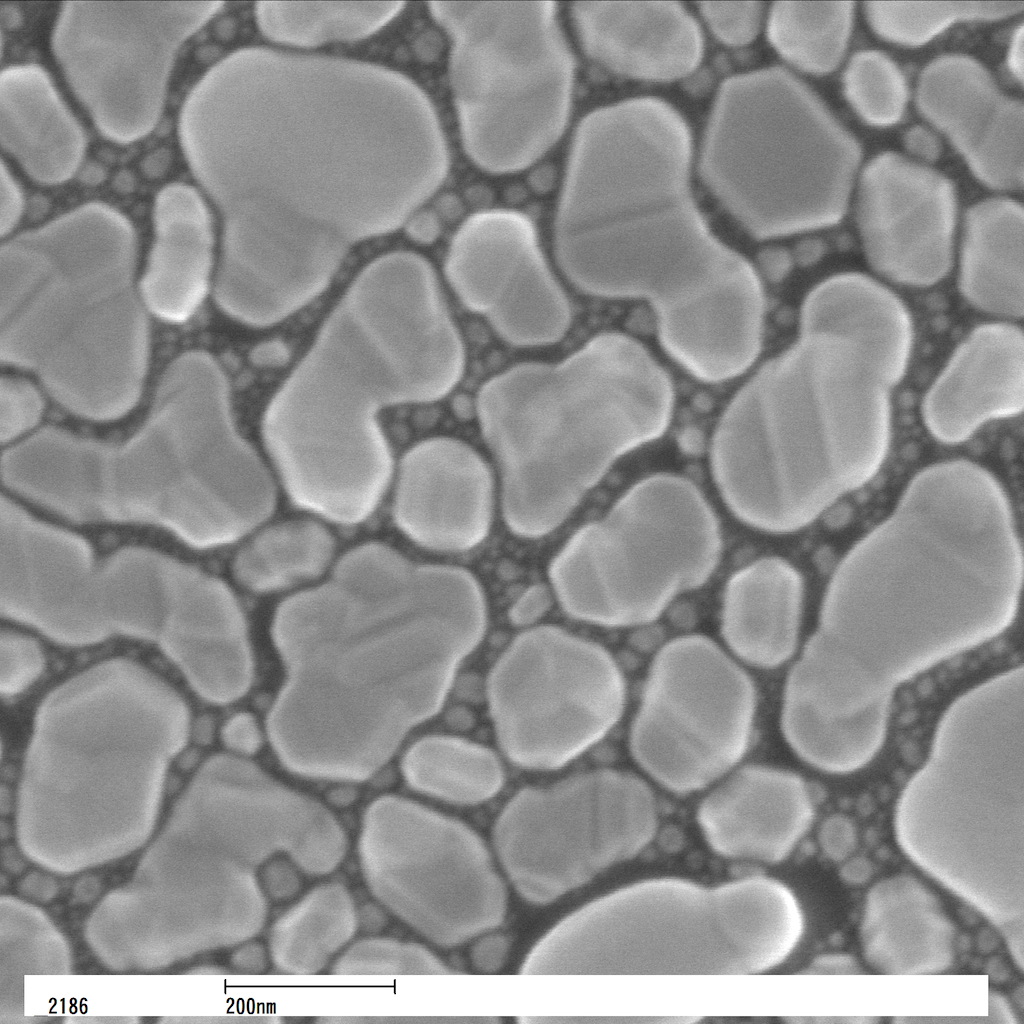
The Elionix ELS G100 electron beam writer provides a gold mark as the only option for optimizing the beam size and beam shape. Each operator will achieve a different level performance and consistency depending on their ability to manually optimize the beam focus and astigmatism. Manually optimizing the beam becomes more difficult and less consistent at higher beam currents, see Figure 2.
Figure 2A: Gold mark imaged using 1 nA beam current. The smallest nanoparticles are visible and sharp.
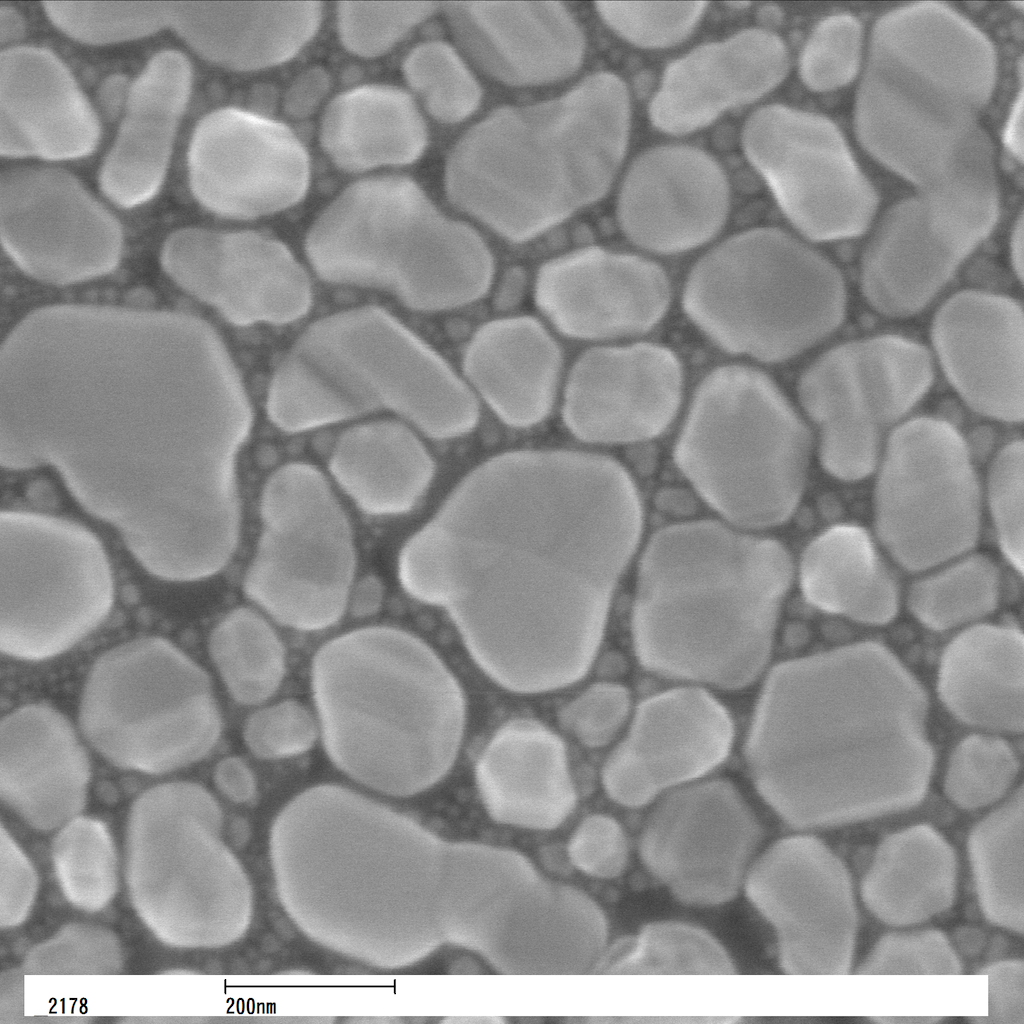
Figure 2B: Gold mark imaged using 2 nA beam current. The smallest nanoparticles are still visible and sharp.
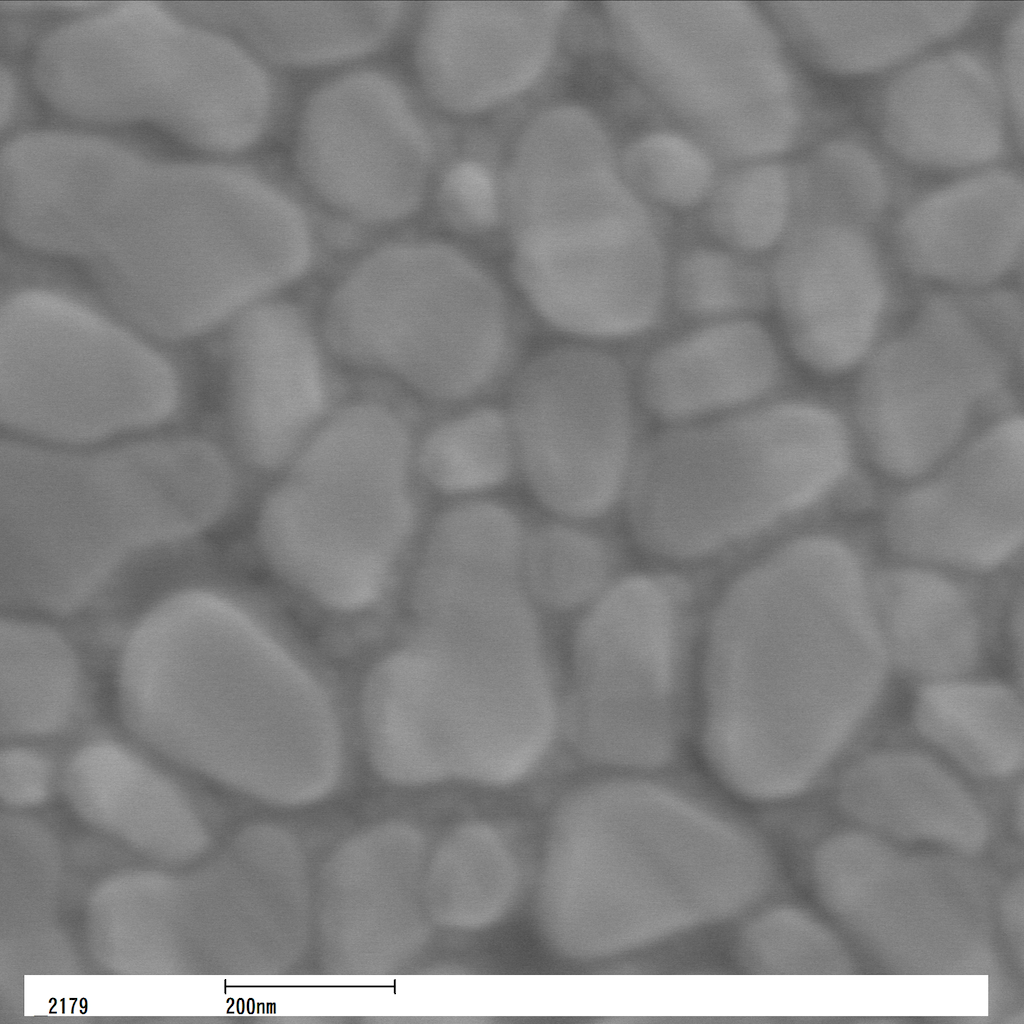
Figure 2C: Gold mark imaged using 5 nA beam current. The smallest nanoparticles are no longer visible and astigmatism is apparent.
Figure 2D: Gold mark imaged using 10 nA beam current. It is very difficult to consistently optimize focus and astigmatism.
AE Mark
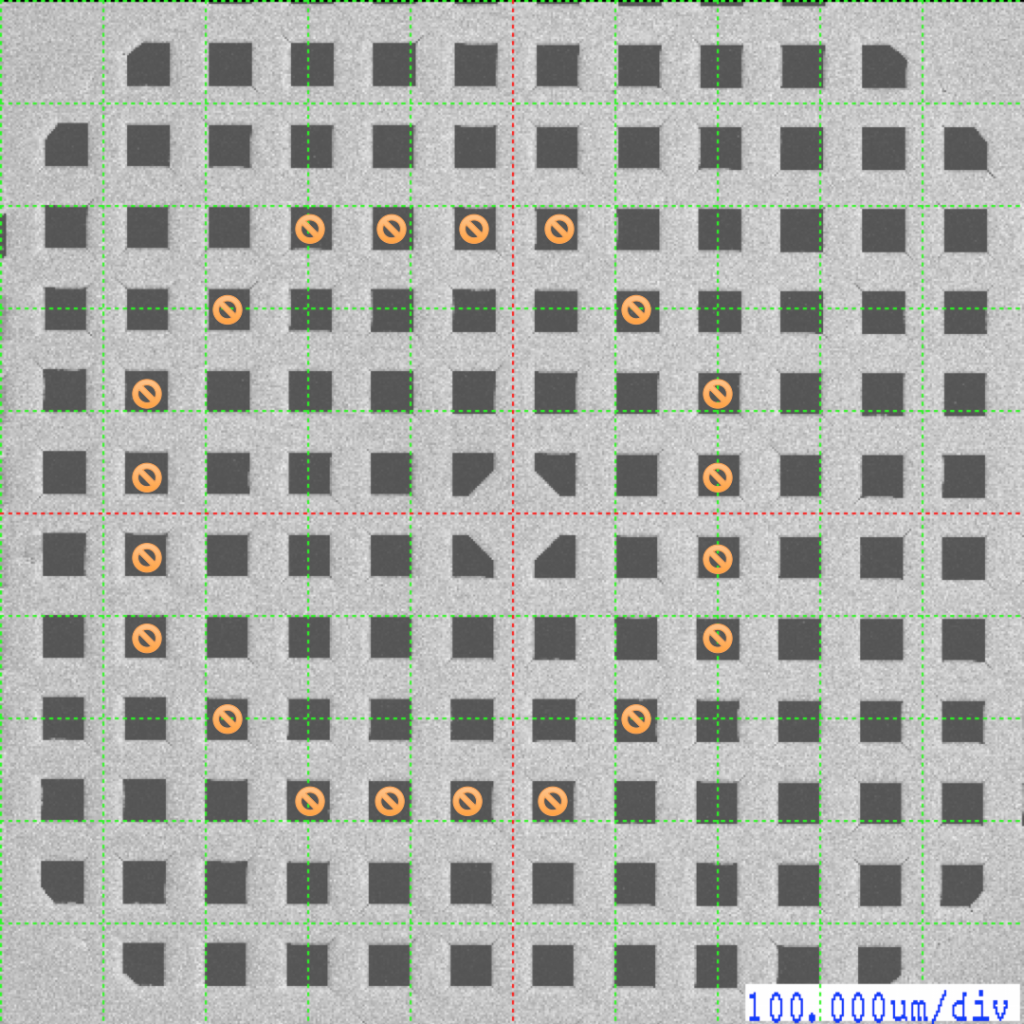
The AE (Absorbed Electron) mark is used to automatically optimize the beam size and shape. The AE Marks used in a Jeol JBX-5500FS electron beam writer is shown in Figure 3. Each mark is a square opening with sharp edges that are opaque to electrons. Located underneath the AE mark is an electron detector. Since the electron detector is smaller than the AE mark, only marks located directly above the detector can be used for calibration. The boundary of the detector is shown in Figure 2 as a ring of no symbols.
Figure 3: The AE marks are the square openings in the grid. Only the marks located inside the orange ring are useable due to the limited size of the electron detector.
The AE mark is used to measure the profile of the electron beam by scanning the electron beam across the knife-edge and recording the transmitted beam current. In an ideal world, the knife-edge is atomically sharp and does not interact with the beam in any other way than perfectly absorbing it. The reality is far from ideal, but this method is capable of measuring the beam diameter with resolution better than 5 nm.
The AE mark is prone to contamination by the electron beam. As the electron beam is swept across the mark, material is deposited along the beam path. This causes the knife edge to be less sharp each time the beam is swept across it. When contamination is significant, a typically smooth transition in the beam profile will develop a kink or a shoulder. This kink in the transition causes errors in determining the beam widths. When a mark is contaminated, the scan position on the mark should be changed. The scan position on a new mark begins at 6 micrometers from the corner and it is moved 0.25 micrometers further from the corner each time it is deemed contaminated. A new mark is chosen once the scan position has reached 15 micrometers. The rate at which a mark gets contaminated is proportional to the beam current and the number of scans.
Each calibration file is assigned a different AE Mark. This strategy maximizes the lifetime of the marks, ensures no cross contamination and prioritizes high performance. The low current calibration files uses marks that are closer to the center of the detector. The high current calibration files all share the same mark. When using high currents, 5 nA and above, the beam is quite wide and it is assumed that resolution is not very important to the operator.
Automatic Focusing
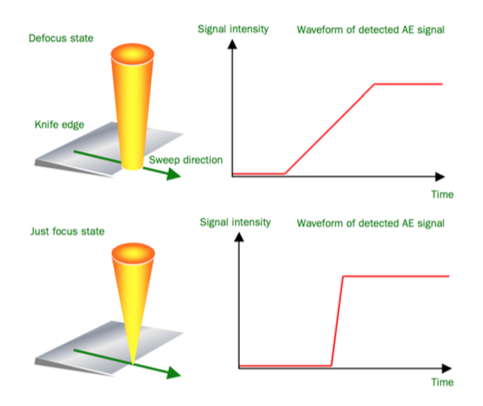
Automatic focusing is a program used to optimize the beam size and shape by iteratively measuring the beam size as the following parameters are changed: focus, stigmatism x and stigmatism y. The beam size is measured using the AE Mark. Figure 4 is a diagram depicting the process for measuring the beam size. The electron beam is scanned across one edge of an AE mark. As the beam is scanned across the edge, the electron detector records the intensity of the electron beam. Plotting the electron beam intensity with time reveals a transition where the beam crosses the edge. This transition is the profile of the beam and it can be analyzed to determine the width of the beam. The beam shape can be determined by profiling the beam along 2 orthogonal edges of the AE mark. This process can be repeated using different beam configurations (focus, stigmatism x and stigmatism y) in order to determine the condition that results in the smallest and roundest beam.
Figure 4: Scanning the beam across a knife edge and recording the beam intensity reveals the width of the beam.
The beam width is determined by modeling the signal measured by the detector. One may consider the convolution of the beam shape with the imperfections of the knife edge and other influence on the signal such as electron scattering, charging and contamination. In practice, the signal is differentiated and fitted with a gaussian curve. The sigma parameter of the gaussian fit is reported as the beam size. This approach is reliable enough to find the beam parameters that produces the smallest beam.
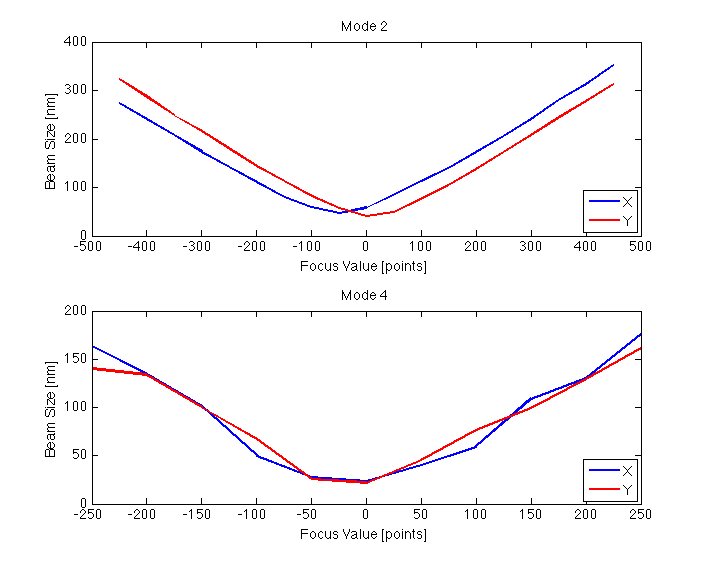
The smallest beam size is determined by measuring the beam size for a set of focus values. Figure 5 shows the width of the beam at various focus values for calibration condition M2_A2_1nA and M4_A2_1nA. The beam is scanned across the right and top edges of the AE mark. The beam profile was analyzed to acquire the width of the beam along X and Y, respectively. When the stigmatism is low, the beam size along X and Y are nearly identical at each focus value. The minimum beam size is extracted by fitting a curve to the data points. Fitting a quadratic function to the 5 data points with the smallest beam size seems to work pretty well.
Figure 5: The optimal focus value can be determined from a beam size versus focus value plot.
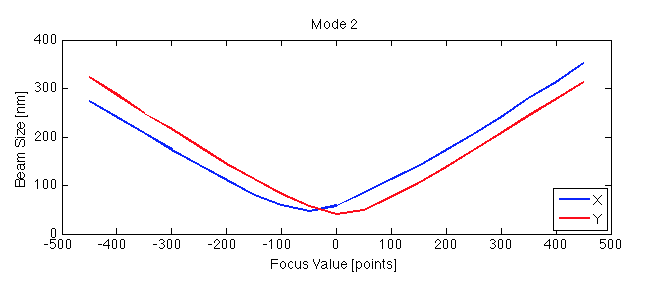
When the beam has significant stigmatism, the beam size along X and Y will differ as shown in figure 6. For example, at a focus value of 0, the beam width along X and Y is approximately 40 and 60 [nm] respectively. In other words, at a focus value of 0, the beam is shaped like an ellipse. In order to have a circular beam, the focus value must be set at -25, where both X and Y beam widths are approximately 50 [nm]. When the beam has stigmatism, it is not possible to achieve the smallest beam size and a circular beam. In addition, the beam shape changes with the focus value. The beam shape can be made circular at all focus values by optimization the stigmatism parameters.
Stigmatism values, Stig X and Stig Y, are used to adjust the focal point of the beam along each orthogonal axis individually. To determine the optimal stigmatism values, the beam widths along x and y must be determined for every combination of focus, stig x and stig y. This is not a practical procedure because each measurement contaminates the edge, increasing the error in successive measurements. Nonetheless, electron beam writers have an automatic routine that optimizes stigmatism until the focus value along X and Y differs by less than some defined value such as 50 focus points for example. From experience, stigmatism can be optimized better manually; and once stigmatism has been optimized, it remains good for over 6 months.
Figure 6: The optimal focus value of the beam is different along the x and y axis.
When stigmatism is optimized, the focal points for the beam along each axis is the same, as shown in Figure 5. Under this condition, the beam is circular and can be focused to the smallest diameter. A stigmatism free beam is relatively easy to achieve in Mode 4 because it uses the higher resolution objective. Beam stigmatism is optimized manually by imaging the AU Mark. When the gold particles in the AU mark cannot be imaged clearly, the BE mark is a good substitute.
The automatic focusing program has a few parameters that an administrator may configure.
Focusing
Enable focus optimization
Stig X
Enable stigmatism X optimization
Stig Y
Enable stigmatism Y optimization
Number of Retries [Times]
Set to 1
Auto-focus DAC value conversion step [point]
Specify the focus step. 50 to 100 points is reasonable.
Auto-stig X DAC value conversion step [point]
Specify the stig X step. 100 to 200 points is reasonable.
Auto-stig Y DAC value conversion step [point]
Specify the stig Y step. 100 to 200 points is reasonable.